


DayTradingtheFutures, SymmetryIndicatorsLLC , JSalesLLC Risk Disclaimers
*Risk Disclosure / Risk Disclaimer:
Risk Disclosure: Futures and forex trading contains substantial risk and is not for every investor. An investor could potentially lose all or more than the initial investment. Risk capital is money that can be lost without jeopardizing ones financial security or life style. Only risk capital should be used for trading and only those with sufficient risk capital should consider trading. Past performance is not necessarily indicative of future results.
Hypothetical Performance Disclosure: Hypothetical performance results have many inherent limitations, some of which are described below. no representation is being made that any account will or is likely to achieve profits or losses similar to those shown; in fact, there are frequently sharp differences between hypothetical performance results and the actual results subsequently achieved by any particular trading program. One of the limitations of hypothetical performance results is that they are generally prepared with the benefit of hindsight. In addition, hypothetical trading does not involve financial risk, and no hypothetical trading record can completely account for the impact of financial risk of actual trading. for example, the ability to withstand losses or to adhere to a particular trading program in spite of trading losses are material points which can also adversely affect actual trading results. There are numerous other factors related to the markets in general or to the implementation of any specific trading program which cannot be fully accounted for in the preparation of hypothetical performance results and all which can adversely affect trading results.
Jason Wireman/Day Trading the Futures/Symmetry Indicators or Jason Wireman employees, do not hold themselves out as a Commodity Trading Advisor (CTA). Given this representation, all information and material provided by Jason Wireman or Jason Wireman employees is for educational purposes only and should not be considered specific investment advice.
CFTC RULE 4.41 -HYPOTHETICAL OR SIMULATED PERFORMANCE RESULTS HAVE CERTAIN LIMITATIONS. UNLIKE AN ACTUAL PERFORMANCE RECORD, SIMULATED RESULTS DO NOT REPRESENT ACTUAL TRADING. ALSO, SINCE THE TRADES HAVE NOT BEEN EXECUTED, THE RESULTS MAY HAVE UNDER OR OVER COMPENSATED FOR THE IMPACT, IF ANY OF CERTAIN MARKET FACTORS, SUCH AS LACK OF LIQUIDITY. SIMULATED TRADING PROGRAMS IN GENERAL ARE ALSO SUBJECT TO THE FACT THAT THEY ARE DESIGNED WITH THE BENEFIT OF HINDSIGHT. NO REPRESENTATION IS BEING MADE THAT ANY ACCOUNT WILL OR IS LIKELY TO ACHIEVE PROFIT OR LOSSES SIMILAR TO THOSE SHOWN. PAST PERFORMANCE IS NOT NECESSARILY INDICATIVE OF FUTURE RESULTS.
Commodity Futures Trading Commission Futures and Options trading has large potential rewards, but also large potential risk. You must be aware of the risks and be willing to accept them in order to invest in the futures and options markets. Dont trade with money you cant afford to lose. This is neither a solicitation nor an offer to Buy/Sell futures, stocks or options on the same. No representation is being made that any account will or is likely to achieve profits or losses similar to those discussed on this web site. The past performance of any trading system or methodology is not necessarily indicative of future results.
NO REPRESENTATION IS BEING MADE THAT ANY ACCOUNT WILL, OR IS LIKELY TO ACHIEVE PROFITS OR LOSSES SIMILAR TO THOSE DISCUSSED WITH Jason Wireman/DayTradingtheFutures.com/SymmetryIndicators.com or Jason Wireman employees, SUPPORT AND TEXTS. Jason WIreman's Sotware/Live Room COURSE(S), PRODUCTS AND SERVICES SHOULD BE USED AS LEARNING AIDS ONLY AND SHOULD NOT BE USED TO INVEST REAL MONEY. IF YOU DECIDE TO INVEST REAL MONEY, ALL TRADING DECISIONS SHOULD BE YOUR OWN.
Trading commodities on margin carries a high level of risk, and may not be suitable for all investors. The high degree of leverage can work against you as well as for you. Before deciding to invest in commodities you should carefully consider your investment objectives, level of experience, and risk appetite. The possibility exists that you could sustain a loss of some or all of your initial investment and therefore you should not invest money that you cannot afford to lose. You should be aware of all the risks associated with commodities trading, and seek advice from an independent financial adviser if you have any doubts
Education and information contained from Jason Wireman/DayTradingthefutures.com/SymmetryIndicators.com or Jason Wireman employees, is not an invitation to trade Crude Oil, Gold Futures or any other futures markets. Trading requires risking money in pursuit of future gain. That is your decision. Do not risk any money you cannot afford to lose. This document does not take into account your own individual financial and personal circumstances. It is intended for educational purposes only and NOT as individual investment advice. Do not act on this without advice from your investment professional, who will verify what is suitable for your particular needs & circumstances. Failure to seek detailed professional personally tailored advice prior to acting could lead to you acting contrary to your own best interests & could lead to losses of capital.
Use of any of this information is entirely at your own risk, for which Jason Wireman/Daytradingthefutures.com/SymmetryIndicators or Jason Wireman employees will not be liable. Neither we nor any third parties provide any warranty or guarantee as to the accuracy, timeliness, performance, completeness or suitability of the information and content found or offered in the material for any particular purpose. You acknowledge that such information and materials may contain inaccuracies or errors and we expressly exclude liability for any such inaccuracies or errors to the fullest extent permitted by law. All information/software from Jason Wireman/DayTradingthefutures/SymmetryIndicators or Jason Wireman employees exists, soley and entirely for educational purposes.
*Risk Disclosure / Risk Disclaimer Continued.
There is a risk of loss in futures, Forex and options trading. There is risk of loss trading futures, Forex and options online. Please trade with capital you can afford to lose. Past performance is not necessarily indicative of future results. Nothing in this site is intended to be a recommendation to buy or sell any futures or options market. All information has been obtained from sources, which are believed to be reliable, but accuracy and thoroughness cannot be guaranteed. Readers are solely responsible for how they use the information and for their results. SymmetryIndicators, Inc. and DayTradingTheFutures, Inc and their affiliated websites., do not guarantee the accuracy or completeness of the information or any analysis based thereon. Margins subject to change without notice. Commission Rule 4.41(c)(1) applies to "any publication, distribution or broadcast of any report, letter, circular, memorandum, publication, writing, advertisement or other literature
." Commission Rule 4.41(b) prohibits any person from presenting the performance of any simulated or hypothetical futures account or futures interest of a CTA, unless the presentation is accompanied by a disclosure statement. The statement describes the limitations of simulated or hypothetical futures trading as a guide to the performance that a CTA is likely to achieve in actual trading. Additional Risk Disclosure Statement for System Traders: Commission Rule 4.41(b)(1)(I) hypothetical or simulated performance results have certain inherent limitations. Unlike an actual performance record, simulated results do not represent actual trading. Also, since the trades have not actually been executed, the results may have under- or over-compensated for the impact, if any, of certain market factors, such as lack of liquidity. Simulated trading programs in general are also subject to the fact that they are designed with the benefit of hindsight. No representation is being made that any account will or is likely to achieve profits or losses. There have been no promises, guarantees or warranties suggesting that any trading will result in a profit or will not result in a loss. Hypothetical performance results have many inherent limitations, some of which are described below. No representation is being made that any account will or is likely to achieve profits or losses similar to those shown. In fact, there are frequently sharp differences between hypothetical performance results and the actual results subsequently achieved by any particular trading program. One of the limitations of hypothetical performance results is that they are generally prepared with the benefit of hindsight. In addition, hypothetical trading does not involve financial risk, and no hypothetical trading record can completely account for the impact of financial risk in actual trading. For example, the ability to withstand losses or adhere to a particular trading program in spite of trading losses are material points which can also adversely affect actual trading results. There are numerous other factors related to the markets in general or to the implementation of any specific trading program which cannot be fully account for in the preparation of hypothetical performance results and all of which can adversely affect actual trading results. (CFTC RULE 4.41) CALCULATED OR SUGGESTED ENTRY AND EXIT POINTS CAN PRODUCE HYPOTHETICAL OR SIMULATED PERFORMANCE RESULTS WHICH HAVE CERTAIN INHERENT LIMITATIONS UNLIKE ACTUAL PERFORMANCE RECORD: SIMULATED RESULTS DO NOT REPRESENT ACTUAL TRADING. ALSO, SINCE THE TRADES HAVE NOT ACTUALLY BEEN EXECUTED, THE RESULTS MAY HAVE UNDER- OR OVERCOMPENSATED FOR THE IMPACT, IF ANY, OF CERTAIN MARKET FACTORS, SUCH AS LACK OF LIQUIDITY. SIMULATED TRADING PROGRAMS IN GENERAL ARE ALSO SUBJECT TO THE FACT THAT THEY ARE DESIGNED WITH THE BENEFIT OF HINDSIGHT. NO PRESENTATION IS BEING MADE THAT ANY ACCOUNT WILL, OR IS LIKELY TO ACHIEVE, PROFITS OR LOSSES SIMILAR TO THOSE PREDICTED OR SHOWN. HYPOTHETICAL OR SIMULATED PERFORMANCE RESULTS HAVE CERTAIN LIMITATIONS. UNLIKE AN ACTUAL PERFORMANCE RECORD, SIMULATED RESULTS DO NOT REPRESENT ACTUAL TRADING. ALSO, SINCE THE TRADES HAVE NOT BEEN EXECUTED, THE RESULTS MAY HAVE UNDER OR OVER COMPENSATED FOR THE IMPACT, IF ANY, OF CERTAIN MARKET FACTORS, SUCH AS LACK OF LIQUIDITY. SIMULATED TRADING PROGRAMS IN GENERAL ARE ALSO SUBJECT TO THE FACT THAT THEY ARE DESIGNED WITH THE BENEFIT OF HINDSIGHT. NO REPRESENTATION IS BEING MADE THAT ANY ACCOUNT WILL OR IS LIKELY TO ACHIEVE PROFITS OR LOSSES SIMILAR TO THOSE SHOWN. SIMULATED RESULTS DO NOT NECESSARILY IMPLY FUTURE PROFITS. THE RISK OF LOSS IN TRADING FOREX OR COMMODITY CONTRACTS CAN BE SUBSTANTIAL. YOU SHOULD THEREFORE CAREFULLY CONSIDER WHETHER SUCH TRADING IS SUITABLE FOR YOU IN LIGHT OF YOUR FINANCIAL CONDITION. HYPOTHETICAL PERFORMANCE RESULTS HAVE MANY INHERENT LIMITATIONS, SOME OF WHICH ARE DESCRIBED BELOW. NO REPRESENTATION IS BEING MADE THAT ANY ACCOUNT WILL OR IS LIKELY TO ACHIEVE PROFITS OR LOSSES SIMILAR TO THOSE SHOWN. IN FACT, THERE ARE FREQUENTLY SHARP DIFFERENCES BETWEEN HYPOTHETICAL PERFORMANCE RESULTS AND THE ACTUAL RESULTS SUBSEQUENTLY ACHIEVED BY ANY PARTICULAR TRADING PROGRAM. ONE OF THE LIMITATIONS OF HYPOTHETICAL PERFORMANCE RESULTS IS THAT THEY ARE GENERALLY PREPARED WITH THE BENEFIT OF HINDSIGHT. IN ADDITION, HYPOTHETICAL TRADING DOES NOT INVOLVE FINANCIAL RISK AND NO HYPOTHETICAL TRADING RECORD CAN COMPLETELY ACCOUNT FOR THE IMPACT OF FINANCIAL RISK IN ACTUAL TRADING. FOR EXAMPLE, THE ABILITY TO WITHSTAND LOSSES OR ADHERE TO A PARTICULAR TRADING PROGRAM IN SPITE OF TRADING LOSSES ARE MATERIAL POINTS WHICH CAN ALSO ADVERSELY AFFECT ACTUAL TRADING RESULTS. THERE ARE NUMEROUS OTHER FACTORS RELATED TO THE MARKETS IN GENERAL OR TO THE IMPLEMENTATION OF ANY SPECIFIC TRADING PROGRAM WHICH CANNOT BE FULLY ACCOUNTED FOR IN THE PREPARATION OF HYPOTHETICAL PERFORMANCE RESULTS AND ALL OF WHICH CAN ADVERSELY AFFECT ACTUAL TRADING RESULTS.
Copyright 2025. Daytrading The Futures - All Rights Reserved
Algorithm Day Trading for the Beginner and Professional Trader.


SymmAlgoIndicatorSuiteNT8vk Indicators Zipped File.


New SymmAlgoIndicatorSuiteNT8vk Workspace Template Zipped File.
Next: Left Click On The Icons BelowTo Download Your New SymmAlgoIndicatorSuiteNT8vk File For Import Into Your NinjaTrader 8 And Next Click on the icon to the right to obtain a FREE copy of the Unirenko Bar Type for install.


This image details the Data series setting for each chart in the SymmAlgoIndicator Suite Daily Workspace. This is the first step in the process to create the exact TradeRoom Workspace. Next you'll add Indicators and Strategies as detailed below to match the charts in the Trade Room.


Free UniRenko Bar Type
Download
FREE
UniRenko Bar Type Download
What your workspace should look like to match the TradeRoom. Click On Image To Enlarge.

** Click Here **
SymmAlgoIndicatorSuiteNT8vk Indicators Zipped File.
Left Click On The Icon Below To Download Your New SymmAlgoIndicatorSuiteNT8vk Workspace Template File For Placement Into Your NinjaTrader 8 In The Workspace Folder:
Here is the path to find the folder to place the workspace file into: Documents\NinjaTrader 8\workspaces

DOWNLOAD PAGE FOR INITIAL SETUP OR TO REBUILD AT ANYTIME.
ATTENTION: Click on the download icon, for your workspace file.
Now, let's set up the charts and your workspace:
Back Up Copies For Download AnyTime Of Your WorkSpace Template Or Chart Templates If They Ever Get Corrupted.
This is a 'Resource Page' for downloads.
*** The Instructions for importing and all installations are ***
*** in the email you just clicked on to come to this landing page. ***
Click The Adobe ICON Above To Download Your New
Sweet Spot Market Structure Guide vk
Market Cycles vk
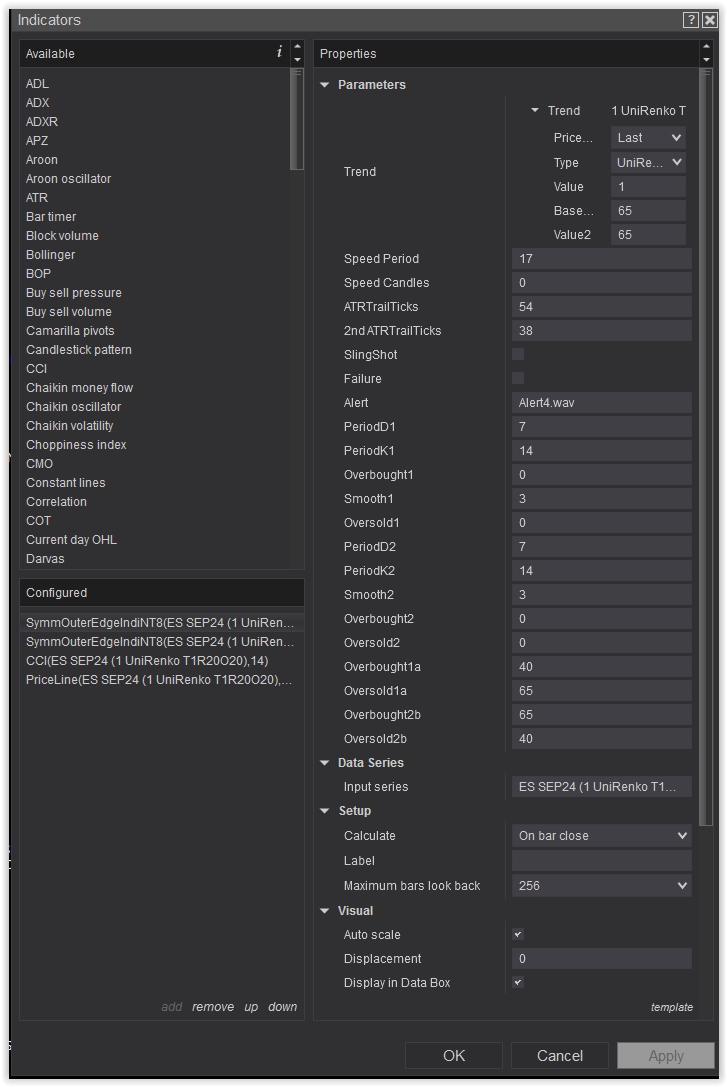
***VERY IMPORTANT: WHEN USING THE UNIRENKO BAR TYPE Trend Parameter SETTINGS ARE CHANGED ON YOUR CHARTS ***
(See the Screenshot above to create your charts accordingly)
***VERY IMPORTANT: WHEN USING THE UNIRENKO BAR TYPE Trend Parameter SETTINGS ARE CHANGED WITHIN YOUR INDICATORS ALSO.***
(See the Screenshots Below to create your charts accordingly)
Click image twice to enlarge
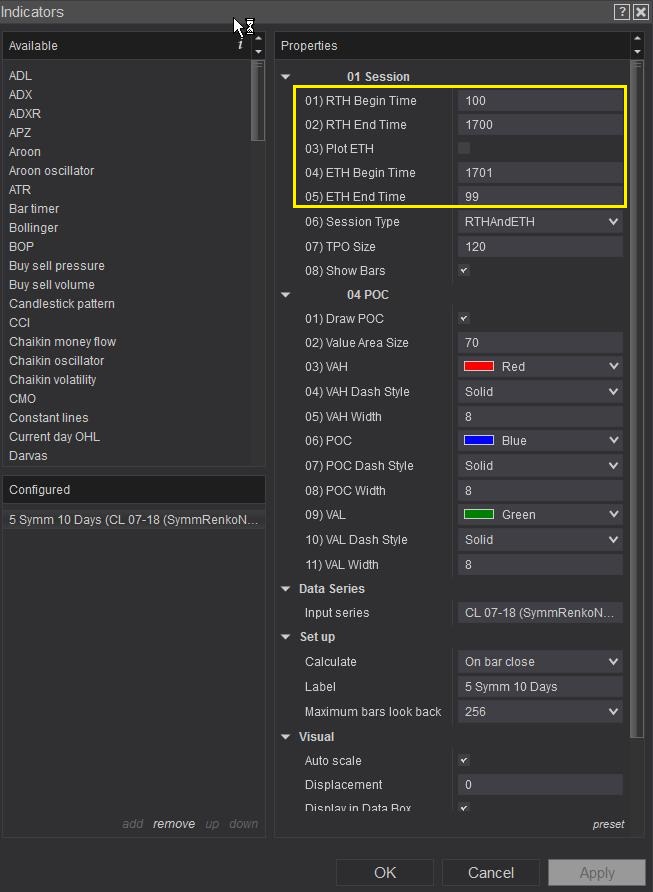
We Are Trading In And Set for Eastern Standard New York Time. If you are running a different time zone, than reduce the RTH Begin, RTH End, ETH Begin And ETH End times Of The SymmProfileNT8 Indicator by the amount of hours behind NY Standard time.
For Example: RTH End Time Of 1700 Is For NY Standard Time, If You are 1 Hour Behind, Than Your New RTH End Time Will Be 1600. If You Are 2 Hours Behind, Than Adjust By 2 And Set to 1500, So Forth And So On, For The RTH Begin, RTH End, ETH Begin And ETH End times. This is ONLY Required For The SymmProfileNT8 Indicator.
Please Save All Your Hard Work and then restart your NinjaTrader to make sure your Workspace Matches The Trade Room.

!! PLEASE REVIEW EACH VIDEO BEFORE ACTIVATING OR TRADING, SO YOU HAVE AN IDEA HOW EVERYTHING CAN WORK. !!
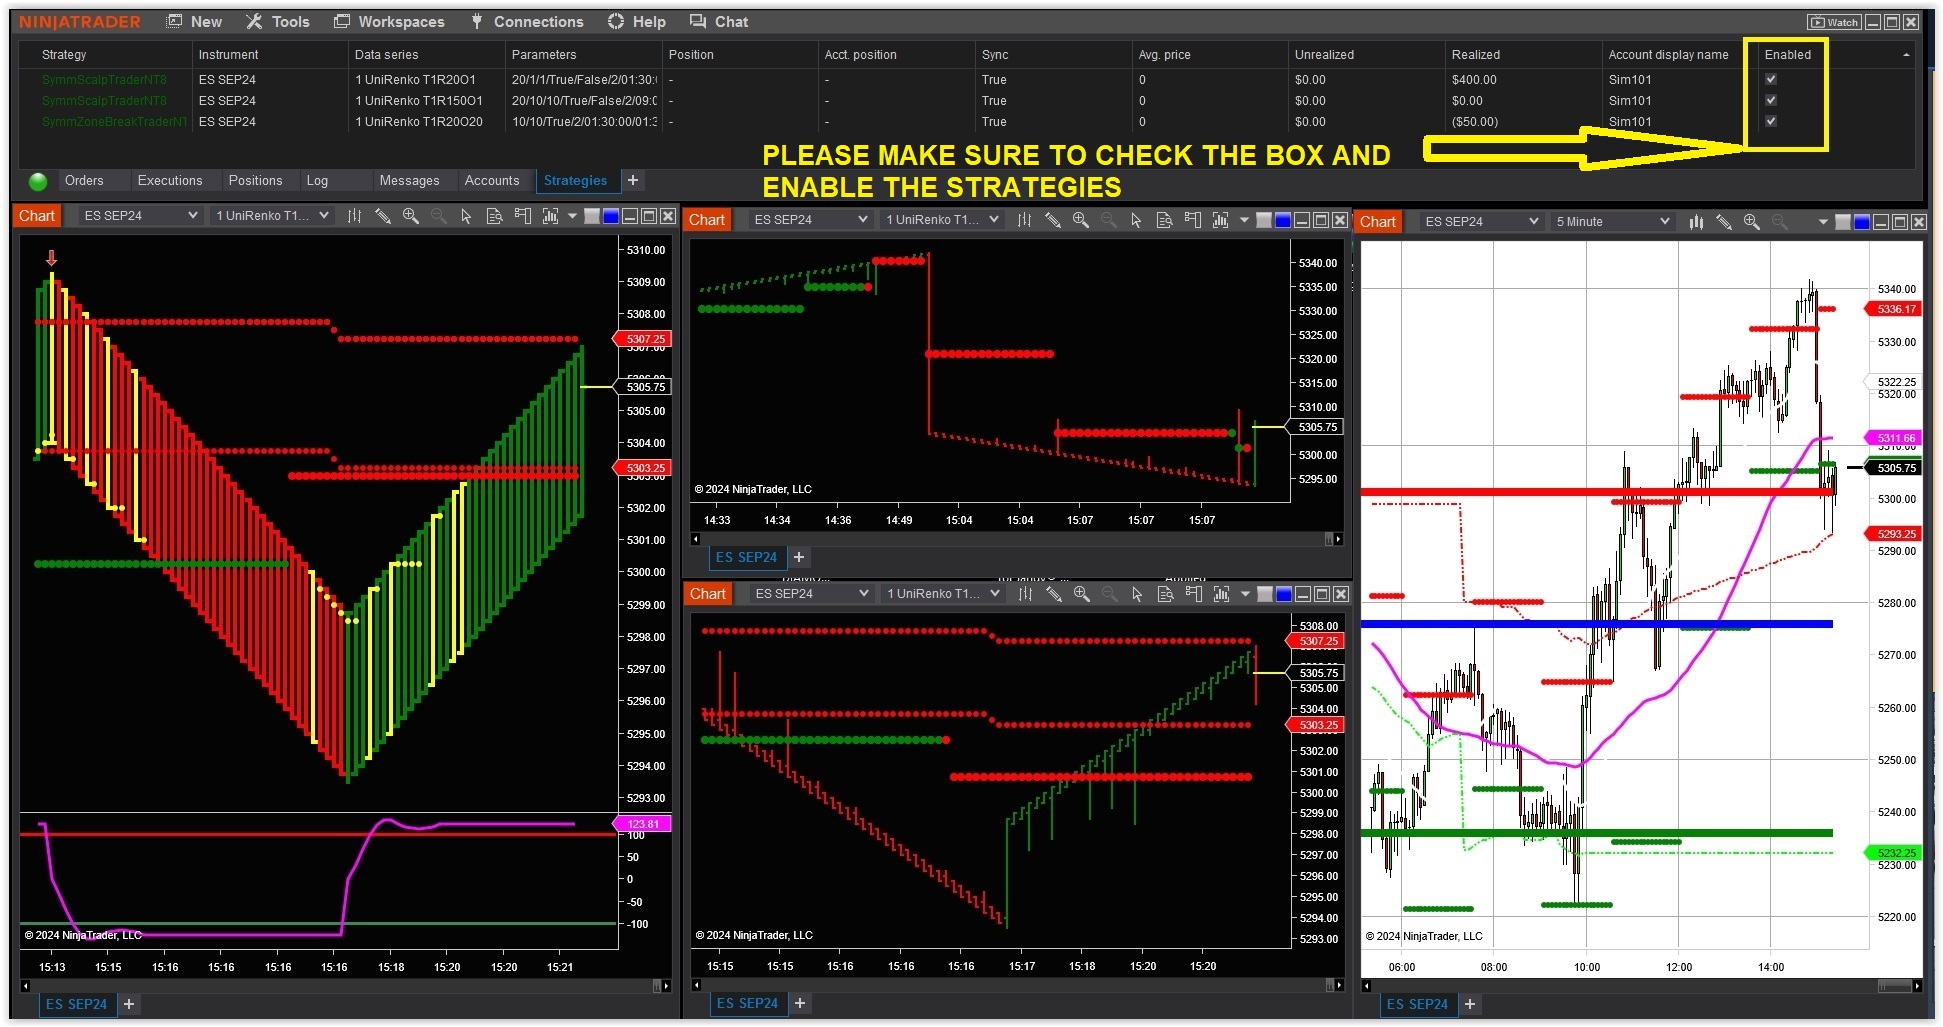
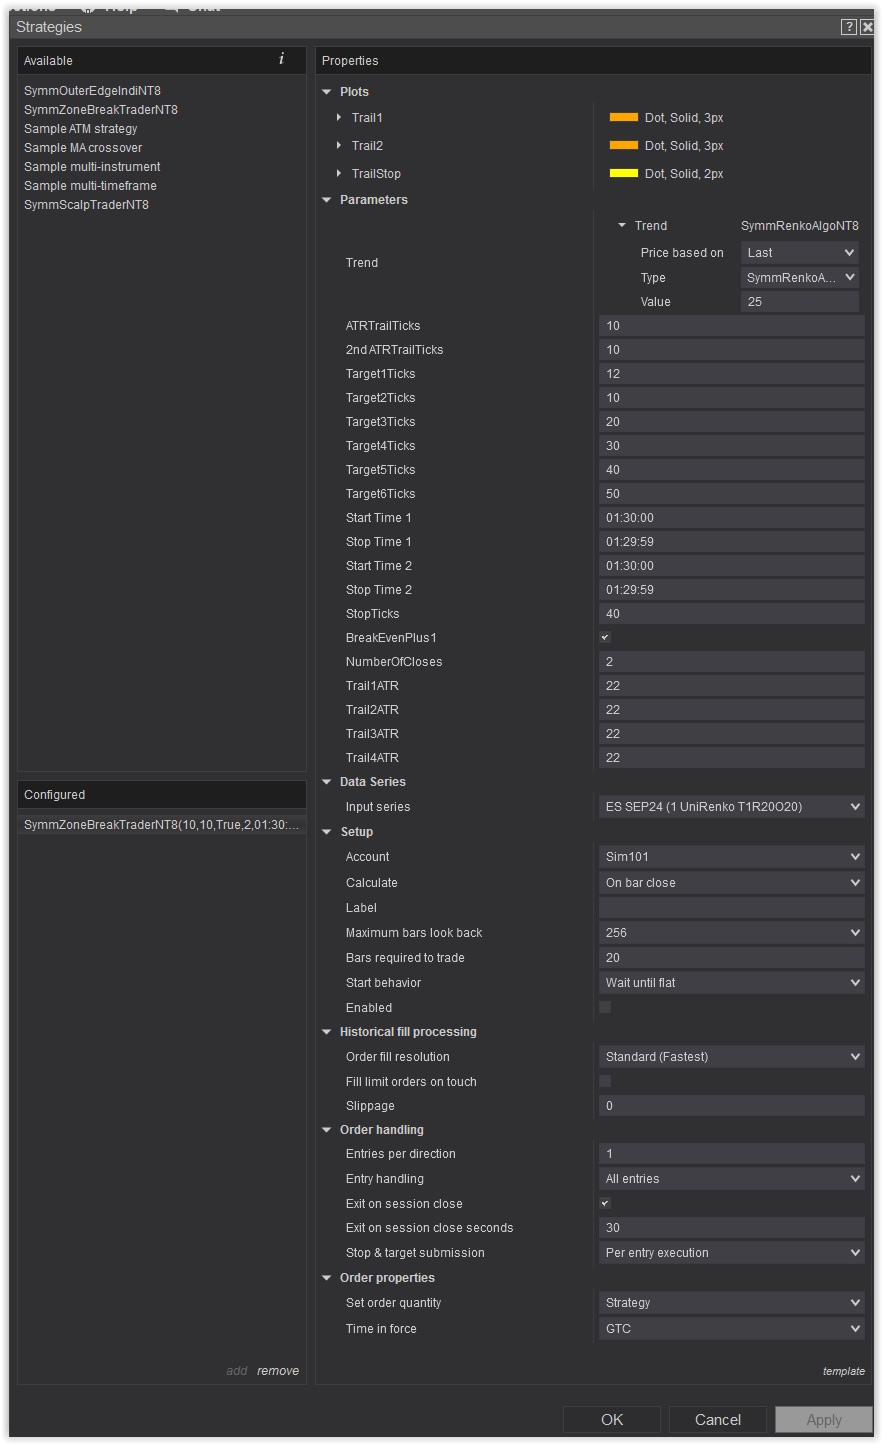
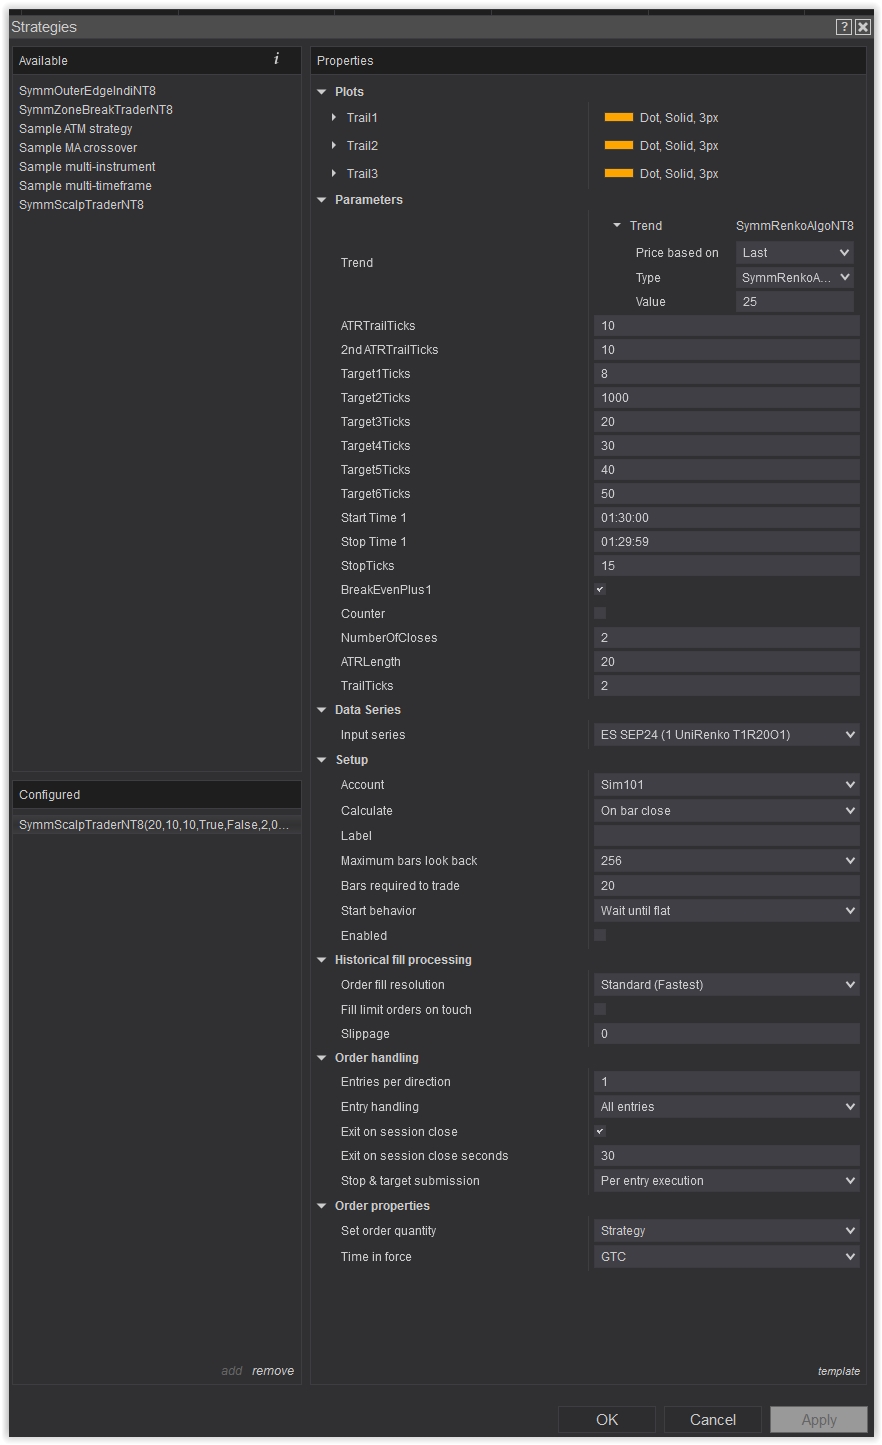
SymmScalpTraderNT8
Ultimate Trend Filter For All Markets
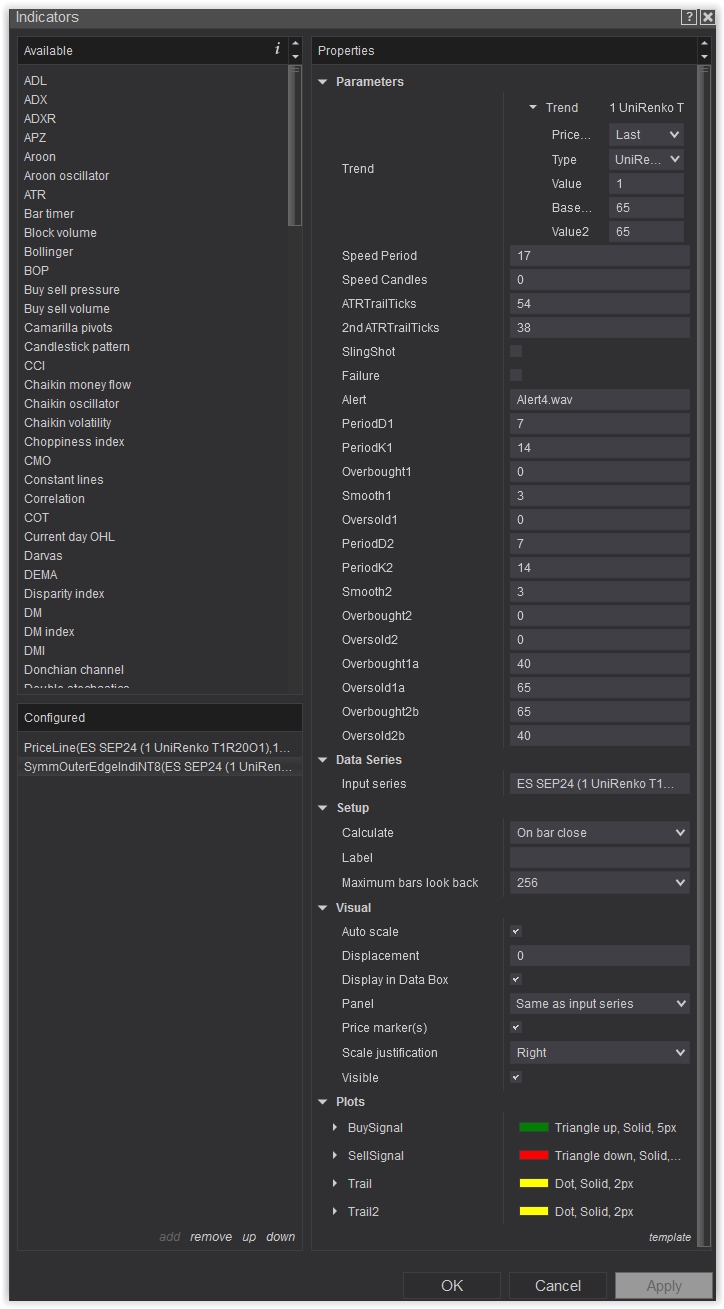
Chart 1 Indicators array
&
Chart 1 Strategy sttings
Chart 2 Strategy only loaded settings
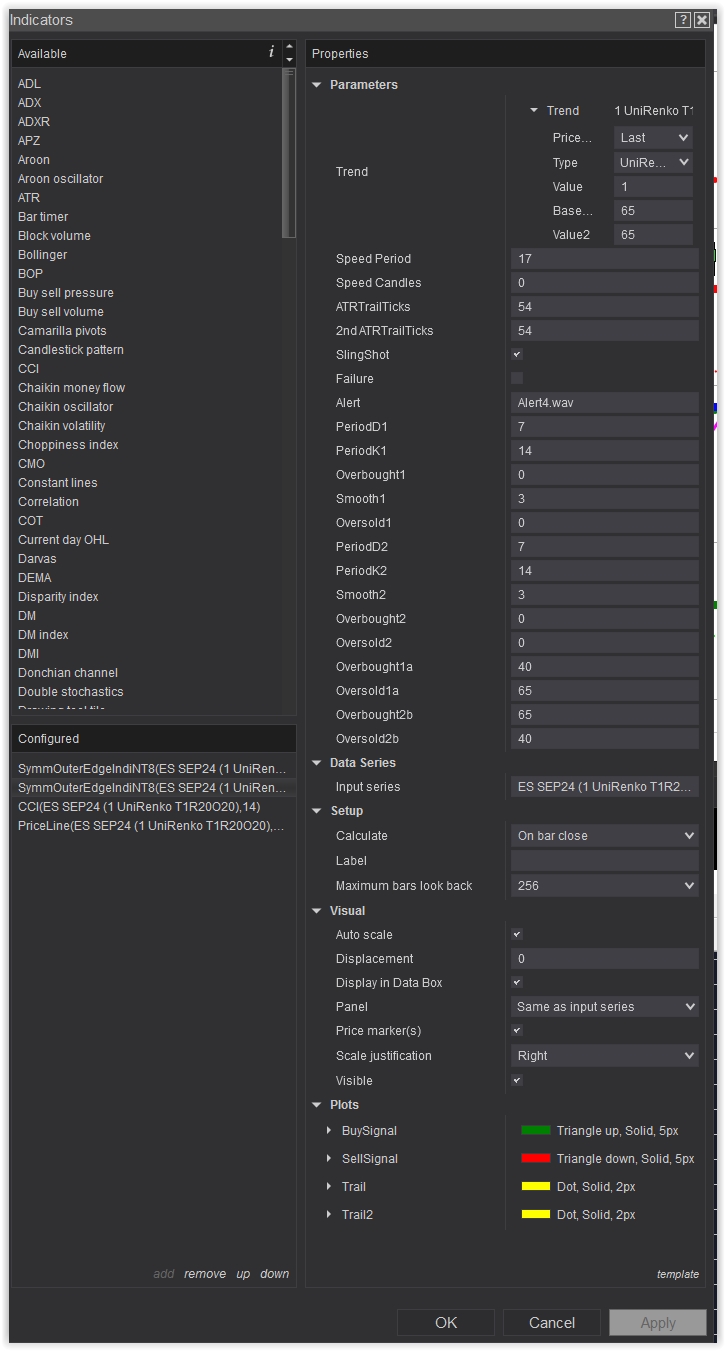
Chart 4 Indicator only array

Click images to enlarge any of them.
Chart 3 Indicator load
&
Chart 3 Strategy load & sttings
1st Install
2nd Install
Click image twice to enlarge
Please make sure to ENABLE your strategies
Click
Icon
Click
Icon
Click
Icon
How To Trade Our V Tops And V Bottoms
Please watch each of these videos to review and refresh technique and rules for the trade
Click
Icon
Click
Icon
Click
Icon
How To Trade The Setups With Our Dual Trend Filter.
SUMMARY of DUAL TREND FILTERS
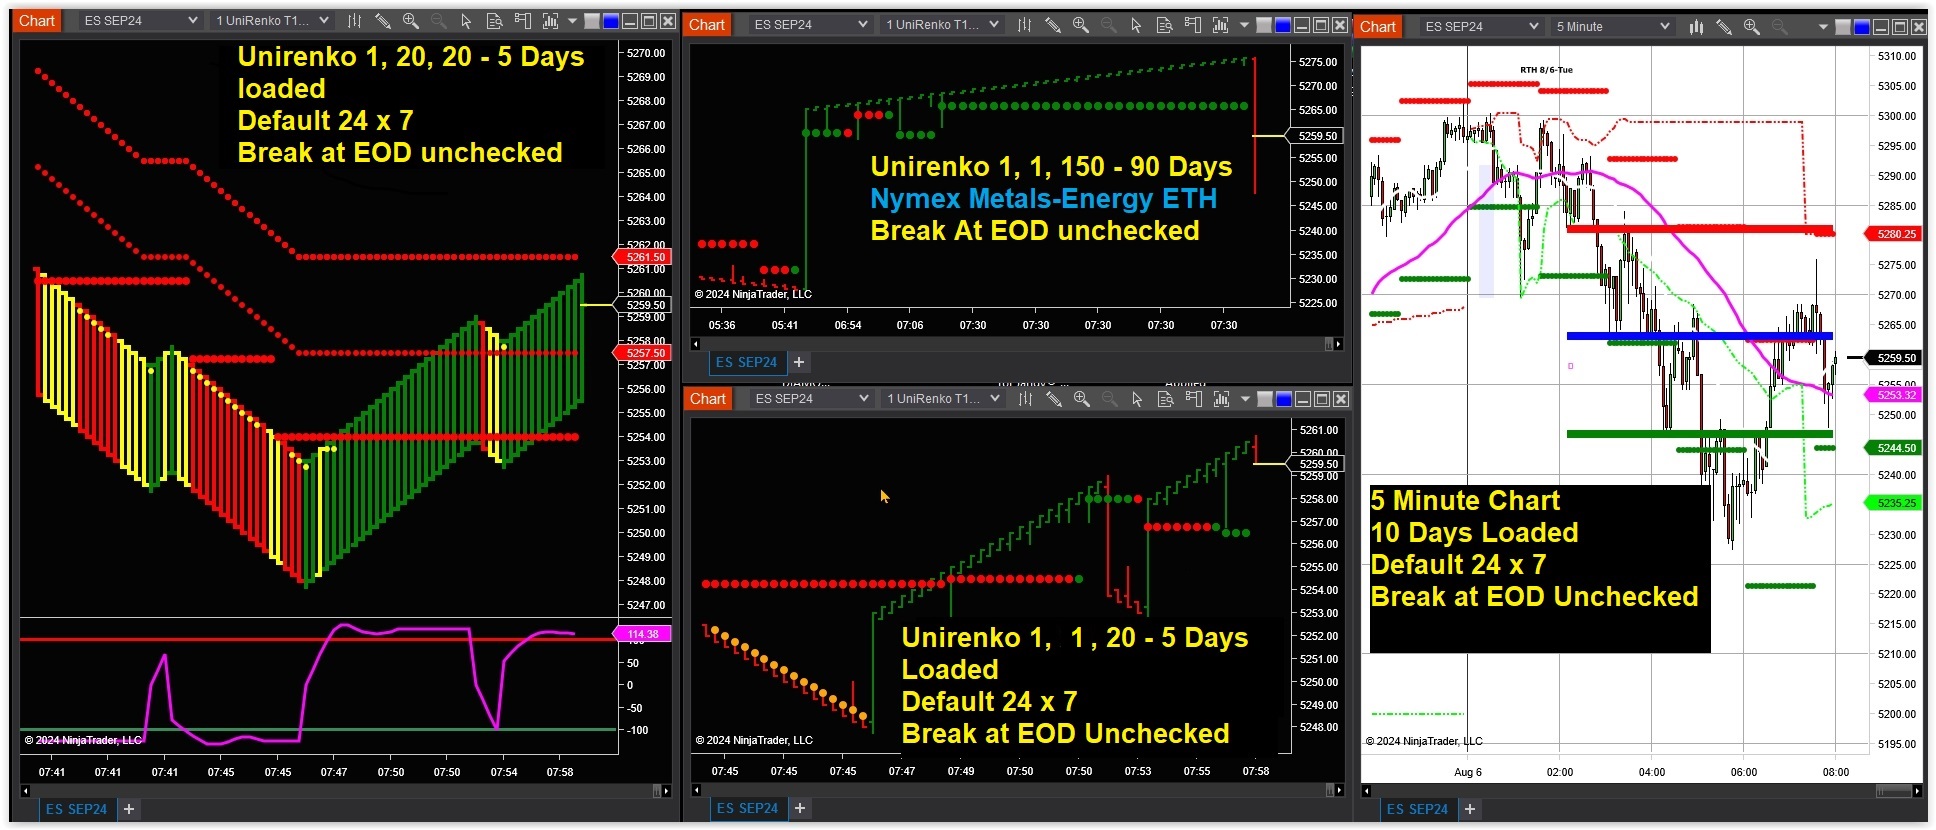
This will show our two sets of Trend Filters that MUST match up GREEN/GREEN for buys or RED/RED for shorts. Here is a summary of how traders can view the filter on any market.
1/20/20 Chart uses our Outer Edge Indicator and our Zone Break Strategy to plot the two Trend Filters on the same chart. The Strategy must be turned on SIM to view the inner Trend dots. The Indicator will automatically show our Trend Zones.
INSERT the Outer Edge Indicator-MUST be set to 1/65/65 UNI RENKO as the Trend Filter at the top of the indicator.
INSERT the Zone Break Strategy-MUST be set to a 25 SYM RENKO bar type as the Trend Filter at the top of the strategy.
(Remember, these are two DIFFERENT BAR TYPES. The indicator uses the UNI RENKO and the Strategy uses our proprietary Sym Renko Bar Type of 25 setting)
This will plot the two zones when the strategy is turned on SIM which will plot the inner higher low or lower high dots and the indicator will show our Trend Zones at run beside each other.
If you are using this chart to view setups only without showing executions that clog the chart, simply right click on the chart and scroll all the way down to plot executions, click do not plot. This will only show the trend filters now or you can put the start time to 130 and end time to 131 and no executions will occur, only showing the Trend Filter. Email me with any questions at jason@daytradingthefutures.com
It is quite easy to set up.
1/1/20 Chart uses the SYM SCALPER as the strategy with the TREND FILTER at the top being the SYM RENKO 25. This is very important that 25 SYM RENKO Bar Type is inserted as the Trend Filter because these are the Market Structure dots that MUST hold on a V top or V bottom that occurs off the 1/20/20. This is what creates the SWEET SPOT setup or the confluence trades between the 1/20/20 and the 1/1/20 chart. These setups are the setups that like to go vertical when they match. Watch recent videos on how this combo works on all markets and how traders favor this setup.
1/1/150 Chart shows the overall big trend of the market and when liquidity grabs are taking place. If the chart is GREEN , then look for buys, if the chart is showing all red candles, then look for sells. The current candle does not count because that's where they are showing the Liquidity Grab. In other words, the best setup in the trade room is the SWEET SPOT V bottom or V top off the 1/20/20 with Market Structure dots holding the 1/20/20 while being in the same trend as the 1/1/150. Keep it simple. I go over this in the room every week on Wednesday, Thursday and Friday at 815 am eastern on the microphone.
Market Profile Chart-This shows when the Market is balanced or imbalanced. Imbalanced markets create speed in that direction of the break only. If above HVA, only buys, if below LVA only sells, if in between both, range market. We go over this in the room.
Remember, if new to the room, FOCUS ON THE 1/20/20 V BOTTOM OR V TOP SETUPS WITH GREEN/GREEN FOR BUYS AND RED/RED DUAL TREND FILTER FOR SELLS. THEN MATCH THE 1/1/20 CHART UP WHEN THE V BOTTOMS OR TOPS HOLD MARKET STRUCTURE DOTS ON THIS CHART. THIS IS THE BEST SETUP IN THE TRADING ROOM AND SOFTWARE AND WE GO OVER THIS IN A LOT OF VIDEOS.
MANY TICKS TO ALL!

KEEP READING DOWN
How To Trade Our Top Setups Part 1
Click
Icon
PLEASE MAKE SURE TO BE RUNNING THE LATEST VERSION OF NINJATRADER OR YOU'LL HAVE ISSUES!!!!!
PLEASE REMOVE ALL OLD VERSIONS OF OUR INDICATOR SUITES OR YOU'LL HAVE ISSUES!!!!!
PLEASE REMOVE ALL VERSIONS OF SYMMETRYDOTSNT8, THEY'RE WITHIN THE SUITE OR YOU'LL HAVE ISSUES!!!!!
NEXT
How To Trade Our Top Setups Part 2
Click
Icon
Same Cycle Setups Everyday
Click
Icon
Click
Icon
How To Trade Daily Cycles On Any Market
Click
Icon
How To Trade Daily Market Cycles With Our Setups
Click
Icon
How to Trade The LG2 Strategy
Click
Icon
V Tops and V Bottoms With The LG2 Strategy
Click
Icon
How to use Market Profile with theLG2 Strategy
Click
Icon
How To Trade Large & Small Renko Sizes W/ The Strategies